
I Built a Tool That Tells Me When a Parabolic Move Is About to Die
Most traders watch candles go vertical and feel one of two things: FOMO or fear. I built something to feel neither.
There is a specific kind of pain that only traders know. You see a coin up 40% on the day. The candles are vertical. Every 5 minutes there is a new high. And you are just standing there watching it, convinced it will keep going.
Then one of two things happens. You get in and it reverses immediately. Or you don’t get in and it goes another 30%.
Both outcomes feel terrible for different reasons.
The Problem With Reading Exhaustion Manually
Parabolic moves end. Every single one. The question is never whether a vertical move will reverse – it is when, and whether you can identify it before the crowd does.
I have been trading crypto long enough to recognize exhaustion patterns. Volume that spikes and dies. Candles that stop making higher highs. Wicks forming at resistance where there were none before. RSI stretching into zones it cannot sustain. These things are real signals. The problem is reading them under pressure, in real time, when every second you are also watching a number move and your brain is trying to override your analysis with emotion.
Discipline is not just about having rules. It is about having a system that enforces the rules when you would rather ignore them.
What I Built
I spent a significant amount of time developing a framework I call the Parabolic Exhaustion System, or PES. It is part of a wider trading methodology I use called MM Sniper, which is built around reading where institutional money is positioned rather than reacting to price alone.
PES specifically addresses the short entry problem. When a coin has moved up 30, 40, 60% in hours, how do you know if it is exhausted or still has legs? How do you avoid shorting into a squeeze that takes another 50% off your position? How do you catch the reversal without guessing?
The framework runs through a series of checks – I call them pillars – that together produce a score and a grade. The grade tells you whether a short entry is valid, and if so, how large to size it. Below a certain threshold, you do not trade. Full stop.
I am not going to share the full framework publicly. It took too long to build and refine through live sessions. But the concept is straightforward: structure beats instinct. Every time.
Then I Automated It
The framework existed as a prompt and a checklist for a while. I would run through it manually before entering a short. It worked well. But I wanted something faster – something I could use from my phone in the middle of a session without pulling up multiple tabs and doing mental arithmetic.
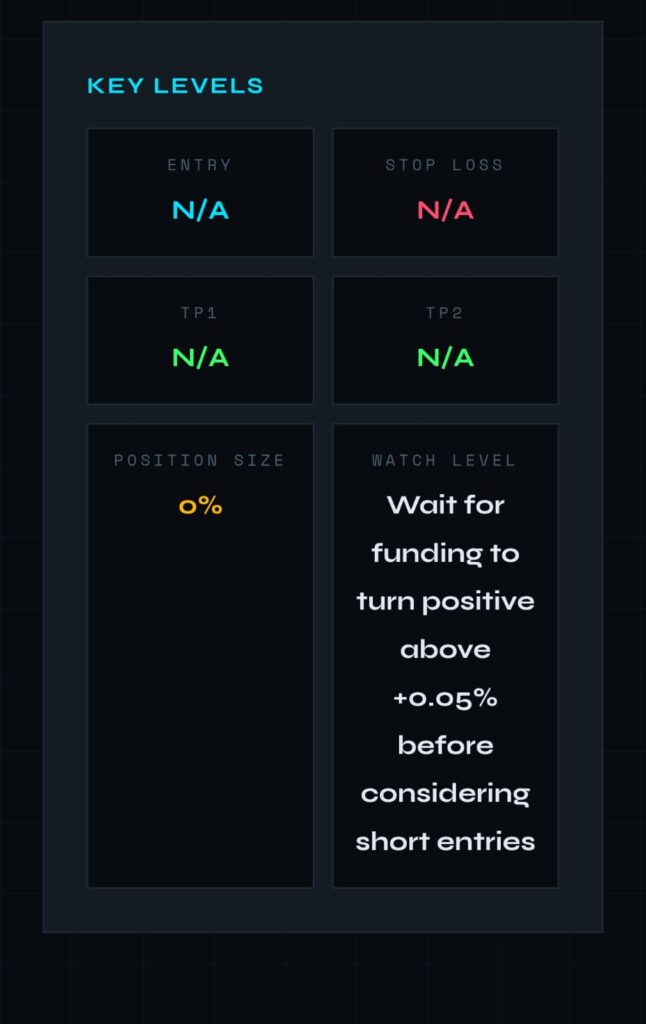
So I built a web tool. You upload a screenshot of your chart and your liquidation heatmap. The tool reads both images, runs the full exhaustion framework against what it sees, and returns a grade, a score, pillar-by-pillar reasoning, and suggested entry and exit levels – all in a few seconds.
No manual data entry. No copying RSI values. No second-guessing whether you read the volume spike correctly. You drop in your screenshots and the system does the analysis.
The logic, the scoring rules, and the API key all run server-side. Nothing sensitive is exposed in the browser. It is a private tool built for one user – me – but the architecture is clean enough that it could eventually be more than that.
A Real Example
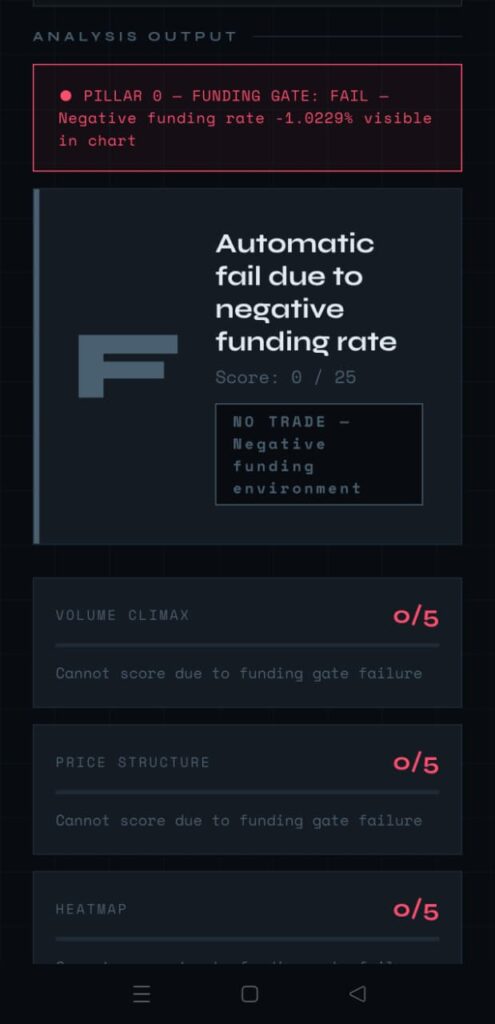
Earlier today I ran SXT/USDT through the system. The coin was up nearly 29% on the day. On the surface it looked like a textbook short candidate – flattening candles, move extended, volume had spiked earlier in the session.
The system flagged it as a no-trade immediately.
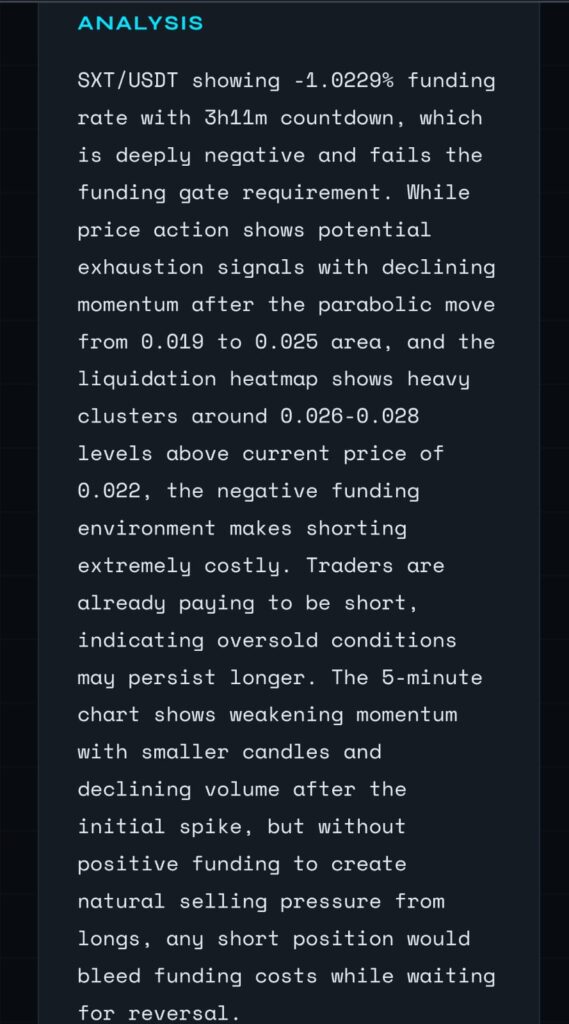
The reason: funding rate was sitting at -0.9966%. That is not a minor detail. At that level, the market is loaded with shorts all paying longs to hold their position every four hours. The liquidation heatmap showed dense liquidity clusters stacked above price between 0.026 and 0.0284. The setup was not exhaustion – it was a loaded spring pointing upward.
Without the framework I might have shorted into that. With it, the answer was obvious before I even finished looking at the chart.
Why I Am Writing About This
Not to sell anything. Not yet, anyway.
I am documenting the build because the process of turning a trading edge into a repeatable, automated system is something most traders never do. They keep their rules in their head, which means they break them under pressure. Writing it down, building it into a tool, stress-testing it against live trades – that process sharpens the thinking in ways that journaling alone cannot.
If you trade crypto and you have a method – not vibes, an actual method – the most valuable thing you can do with it is build systems around it. Reduce the surface area for emotion. Make the framework do the work.
More on where this is going soon.